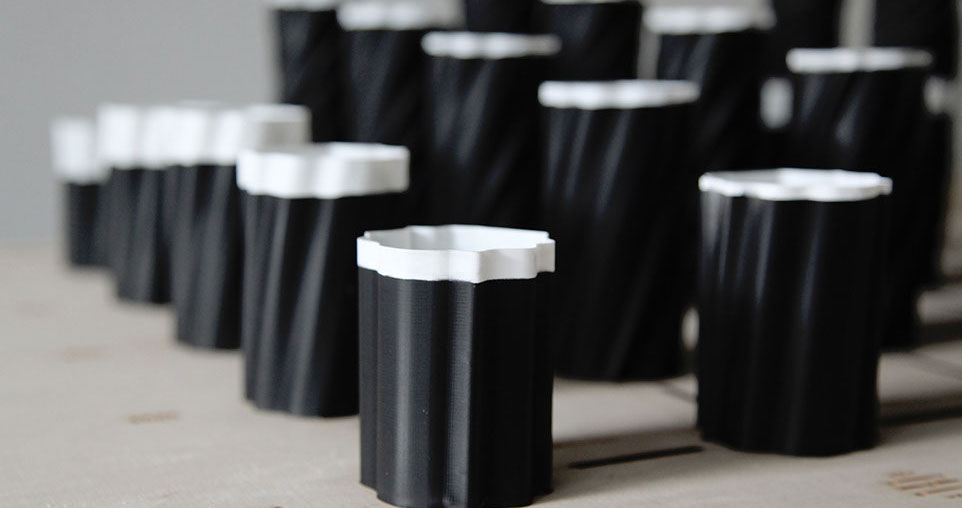
The data object
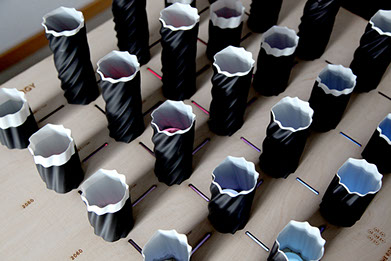
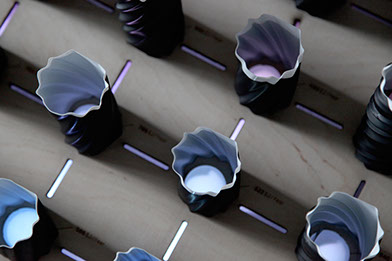
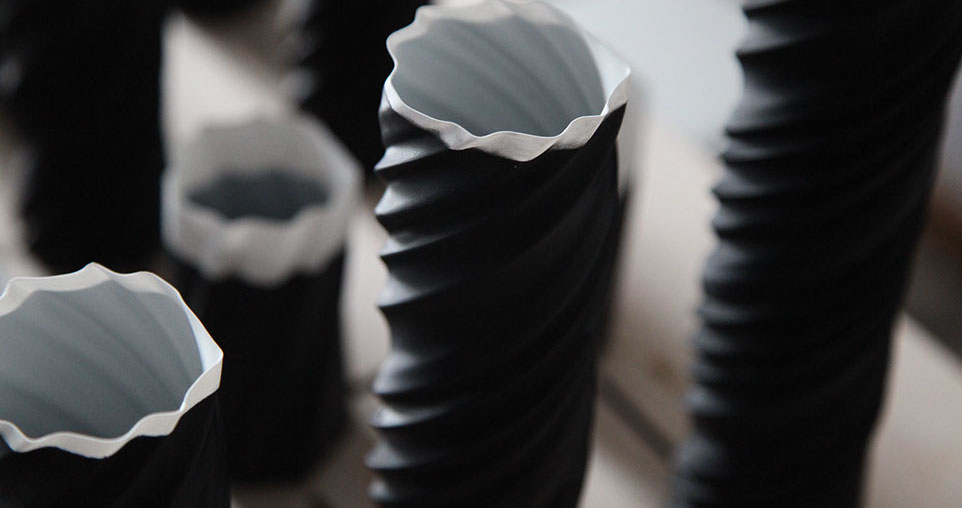
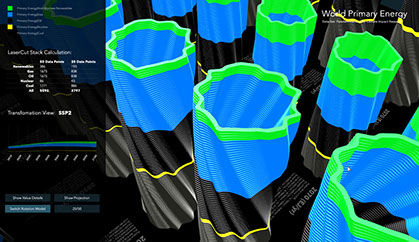
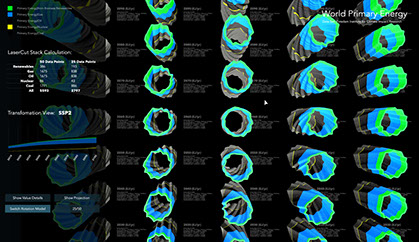
The object consists of 25 pillars printed in 3D. The height of each object represents the global consumption of primary energy per year (in Exajoules/year). Each object is divided in renewable energies (in white), and fossil fuels (in black). The twisting shows the distortion of energy developments in the future, compared to the start value.
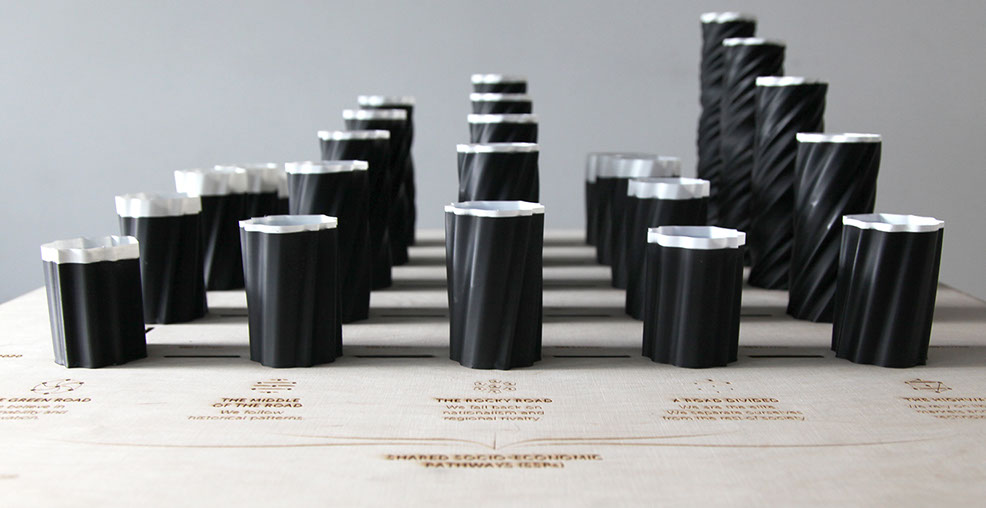
The pillars are placed on a two-dimensional grid. The y-axis shows the time from 2020 - 2100. The x-axis shows the Shared Socio-economic Pathways.
shows the distortion of energy developments in the future scenarios.
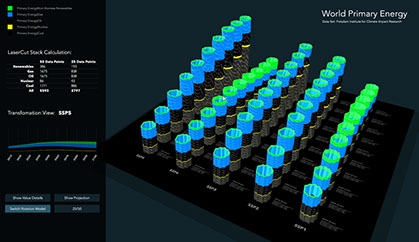
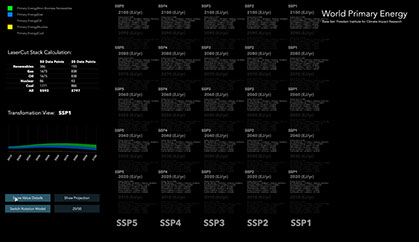
1. Computational Model
During the development process of this object we developed a tool, which allowed us to read the dataset and map the parameters to our object simulations. Using this method, we were able to deeply study and analyse the dataset. We used the tool to find related forms, calculate values for the building process and experiment with different appearance characteristics. We worked with VVVV to program this tool.

2. Projection mapping
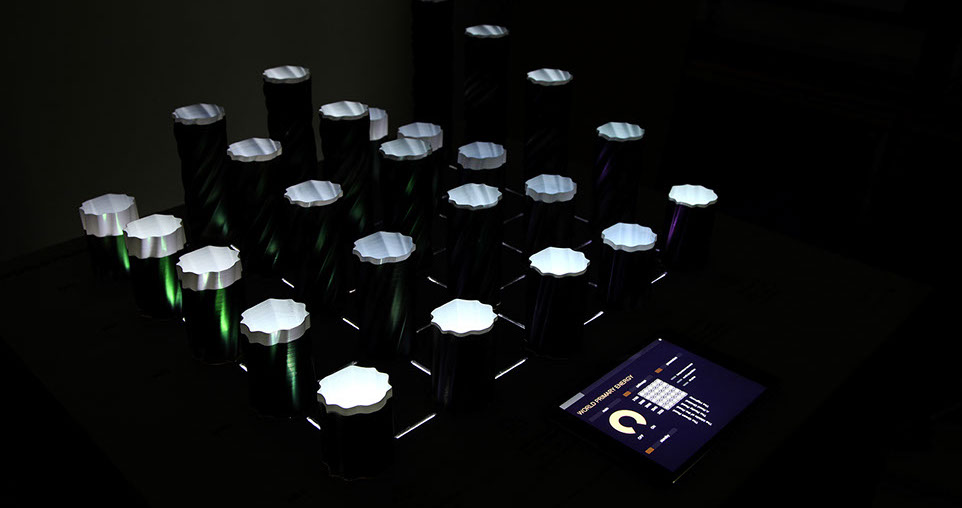
Besides the computational model, we experimented with rear projections on and through different surfaces. We decided to work with laser-cut wood as a canvas tor the projection. The wood board is lit from below using a projector. The board serves as a mask while the cuts define a grid for the projection, through which graphical components such as heat plots can be projected. The projection was mapped using a VJ software (Resolume). We designed an app to act as a remote control. It uses TouchOSC to communicate with Resolume and trigger clips. The video clips and animation help focus on some parameters and direct the viewer's attention.
The projection
The app-controlled projection allows to highlight the pillars and compare several pathways during discussions or presentations. In order to stimulate deeper understanding, we included additional data parameters that contrast or support the energy data. Our prototype includes models for global warming and population growth. For each additional data layer, we developed a different visual metaphor to help differentiate the parameters.
Reflection
The prototype is a starting point for further iterations. The projection of more data parameters could offer new insights and stimulate discussions. Nearly any social and economic parameter can be linked to the development of energy resources. Comparing these layers is very useful to understand connections within the PIK data model.
The rotating form language is very strong and could also include other qualitative parameters, such as a social development index.
It would represent the “deformation of society” for every SSP and would enrich the object by adding a critical layer to it.
What is the dataset about?
What are shared socio-economic pathways? The Potsdam Institute for Climate Impact research is developing new scenarios integrating future changes in climate and society to investigate climate impacts as well as options for mitigation and adaptation. One component of these new scenarios is a set of alternative futures of social development known as the shared socio-economic pathways (SSPs).

The Green Road
World primary energy
This data visualisation shows the world’s future consumption of primary energy resources. For this, we examined the worldwide development of energy consumption from 2020 to 2100, throughout 5 possible scenarios.
The dataset provided by the Potsdam Institute for Climate Impact Research consists of a huge amount of complex parameters. These can be hard to grasp for non-scientists.

From digital to physical:
the building process


3. Rapid Prototyping and Production
The final form models were generated in VVVV and Grasshopper. We used a 3D printer (FDM) to build the 25 energy pillows. The ground board was designed using a graphical editor and prepared for laser-cutting. The projector is placed underneath the board, in front of a mirror. The mirror reflects the light onto the board from below. The 25 pillars are placed on top of the board.
© Katja Budinger Stéphane Flesch Roman Grasy Kathi Veitengruber
This project was created during the course "Data objects" with Boris Müller at the FH Potsdam. Data provided by Potsdam Institute for Climate Impact Research.


The Middle of the Road
Our physicalisation aims to make it more tangible and less abstract. It supports the analysis and comparison of some excerpts of the database. Moreover, it illustrates the complexity of the subject and allows viewers to engage in discussions about future climate scenarios.
The SSP narratives are a set of five qualitative descriptions of future changes in demographics, human development, economy and lifestyle, policies and institutions, technology, and environment and natural resources. The dataset enables citizens and decision makers to gain insights about probable developments in climate and socio-economic conditions.


The Rocky Road
A Road Divided
The Highway